September 2026
Where money becomes real.
Everybody in steel is on allocation, and the answer to “what's driving it” is data centers. I pulled 20 years of price sheets to see what that looks like, and what it says about who is carrying the risk of the AI buildout.
That's what an old friend in structural steel told me when I asked what's driving demand. Beam prices are over $100 a hundredweight and everybody's on allocation.
Another friend buys flat-rolled steel (the sheet that becomes electrical housing units, containers, cars, anything roll-formed). He has contracts with several mills. He placed an order that was confirmed back in June, and only recently found out it was cancelled on him. Nucor's posted spot price for hot-rolled coil was $1,160 a ton ($58/cwt) in mid-August, after three straight weekly increases.
What I really enjoyed about the steel industry was the direct pulse on the economy. You see in real time when actual dollars are being put to work. Nothing is closer than when steel is purchased, fabricated and sent to the job site. That's when money becomes real.
The AI buildout is real money being spent today, financed on revenue that shows up later and cheaper than it's priced for. The risk is moving to the public. Steel is where you'll see it turn first.
20 Years of Price Sheets
So I went back and pulled every Nucor-Yamato price sheet I could find in the Internet Archive, 48 of them, 2005 to today. Nucor-Yamato is one of the largest wide-flange beam mills in the country, and it publishes its list prices.
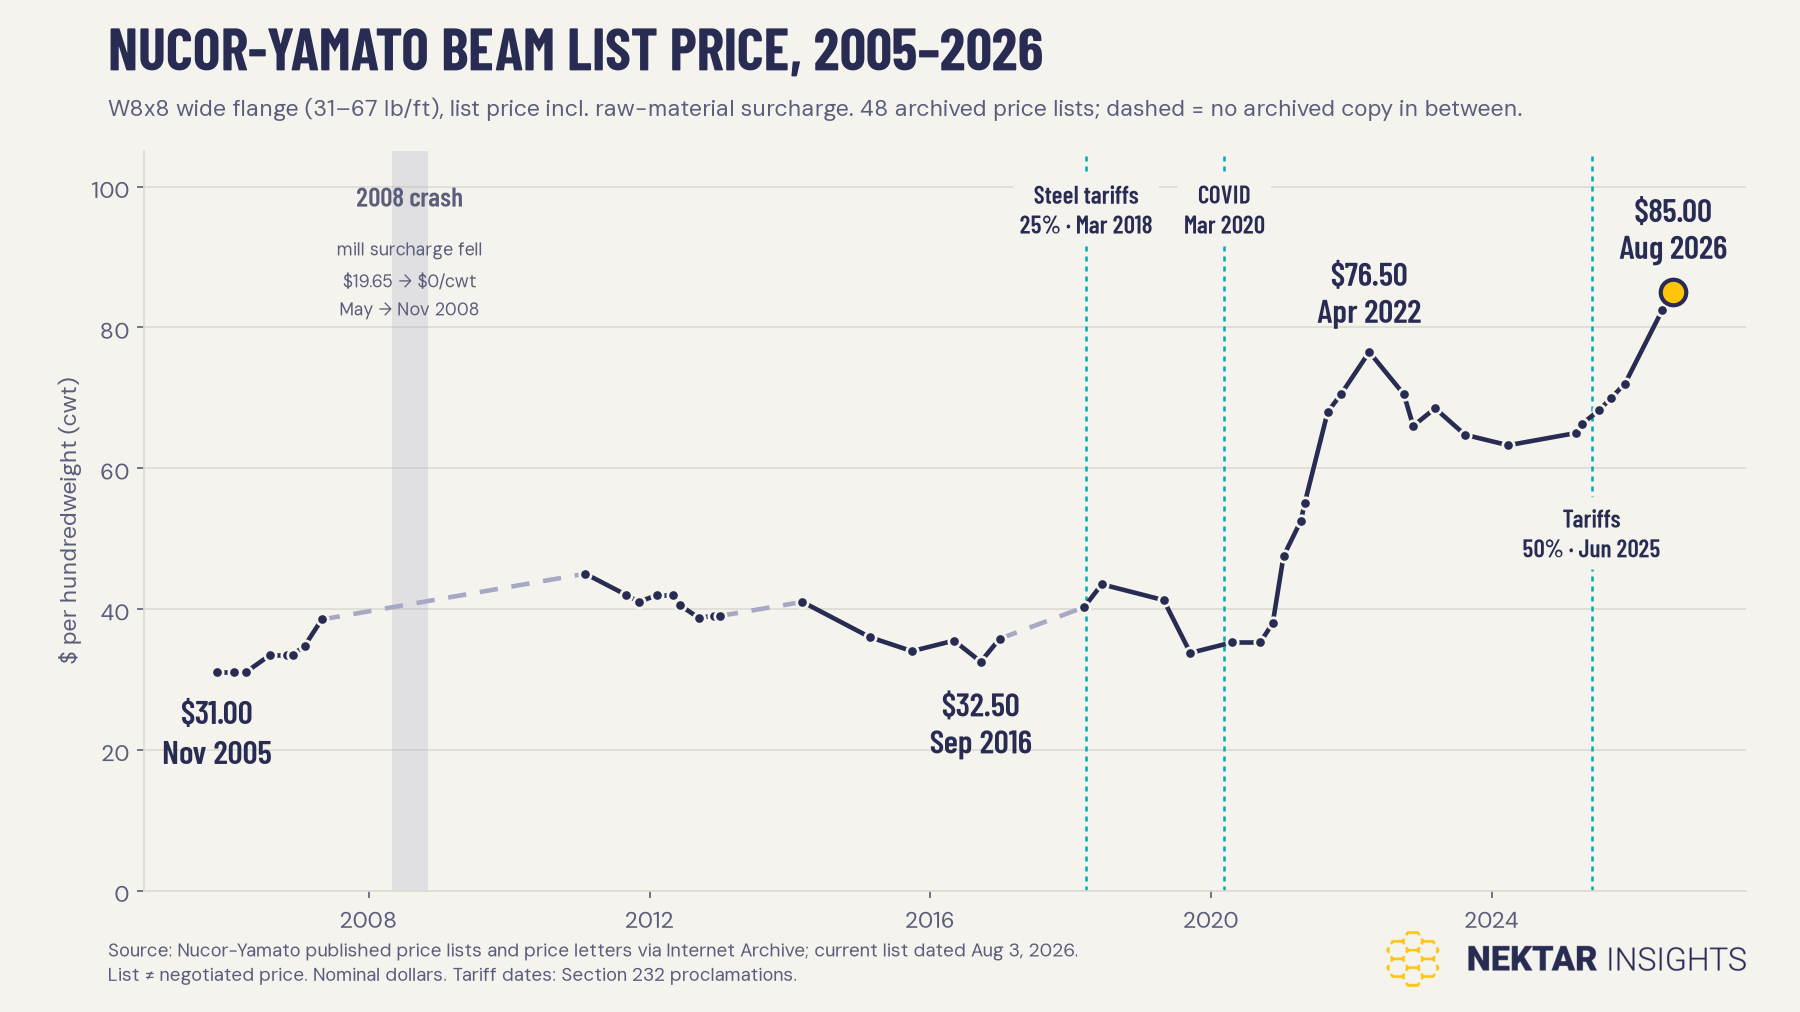
What to notice: Prices fell back after the 2018 tariffs and again after 2022. Every archived sheet since March 2024 has been higher than the one before it, seven in a row.
From 2012 to 2016, beams listed at $32 to $42 a hundredweight. Today the lightest beams list at $85, and the heavier sections are over $100. The very heaviest don't show a price at all. The sheet just says “Inquire.”
Tariffs are part of that. They went to 50% in June 2025. But when the 25% tariffs hit in March 2018, beam prices rose to $43.50 and were back down to $33.75 by the fall of 2019. Tariffs alone didn't hold prices up last time. The biggest move on the chart came after COVID: from $38 at the end of 2020 to $76.50 by April 2022.
Today's $85 is a record in nominal dollars. Adjusted for inflation, the April 2022 peak is worth about $88.60 today, so we're close to that peak, not past it. And a list price is where negotiation starts, not where it ends. What the list does show is direction, and the direction is up.
Why Steel Moves First
A data center gets steel long before it gets power. Beams go into the building shell; the transformers, switchgear and grid connection come later. So steel demand tracks how many projects are breaking ground, not how many will actually get energized and start earning.
That gap is the whole story. Mills, fabricators and equipment makers price against the pipeline. The revenue comes from what gets plugged in.
That's why the beam chart matters. Steel prices are the first place the pipeline shows up, and they'll be the first place it shows up when it stops.
Planned Is Not Delivered
From my solar days I know interconnection issues are real. Planned is not delivered. Historically only 13–20% of proposed grid projects actually get built, per Lawrence Berkeley National Lab.
Data centers inherit the same problem. Developers file for power in several places at once to see which comes through first. Energy analyst Shanu Mathew's April 2026 reconciliation puts the disclosed US pipeline at 241 GW, against forecasts of roughly 100 GW actually realized by 2035, and a realistic 15–20 GW energized in 2026. The time from a grid request to operation has gone from about two years in 2008 to about five today. CoreWeave, one of the fastest builders, ended 2025 with 850 MW running against 3.1 GW contracted.
Now there's politics too. Maine's legislature passed a freeze on new builds over 20 MW, at least 15 other states are moving similar measures, and projects worth at least $156 billion have been blocked or delayed by local opposition.
Who's Paying For It
The money going in is enormous. A Fidelity chart shows US non-financial companies raising about $3.25 trillion a year in net new debt and equity, roughly the level of the dot-com peak. A lot of it is borrowed. The biggest tech companies used to pay for buildouts out of cash flow; more of it now runs through bond deals and private credit.
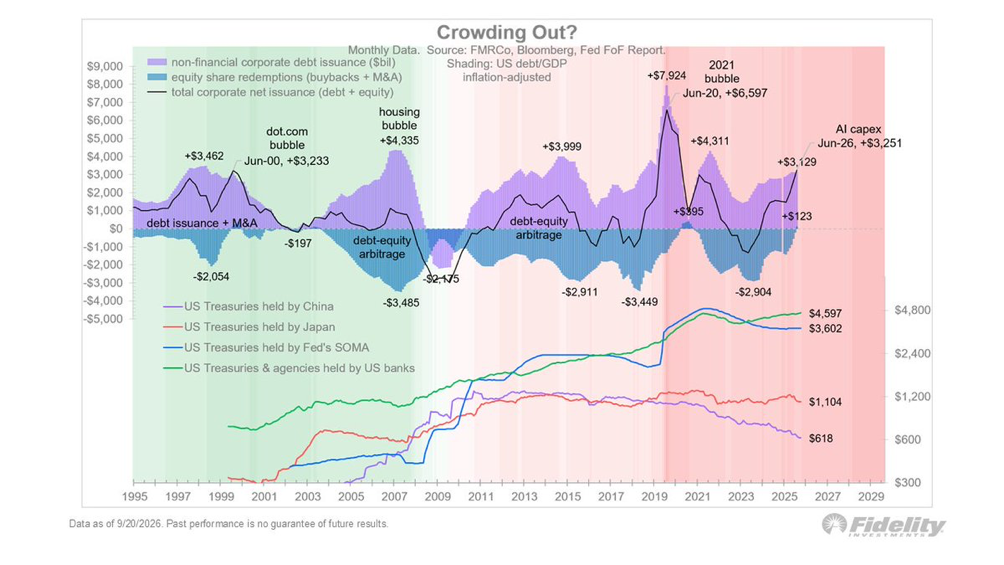
What to notice: Companies are raising money at dot-com levels while the government borrows too, and the big Treasury buyers (the Fed, China) are pulling back. That keeps money expensive for exactly the kind of long-lived asset a data center is.
On the private side, Steve Rattner charted three companies, SpaceX, Anthropic and OpenAI, at a combined $5.2 trillion, against $4.1 trillion for every US tech IPO from 1980 to 2025 combined. That comparison mixes today's dollars with 1999's. Put the IPOs in today's dollars and they add up to $6.4 trillion. Three companies are still worth about 80% of 45 years of tech IPOs.
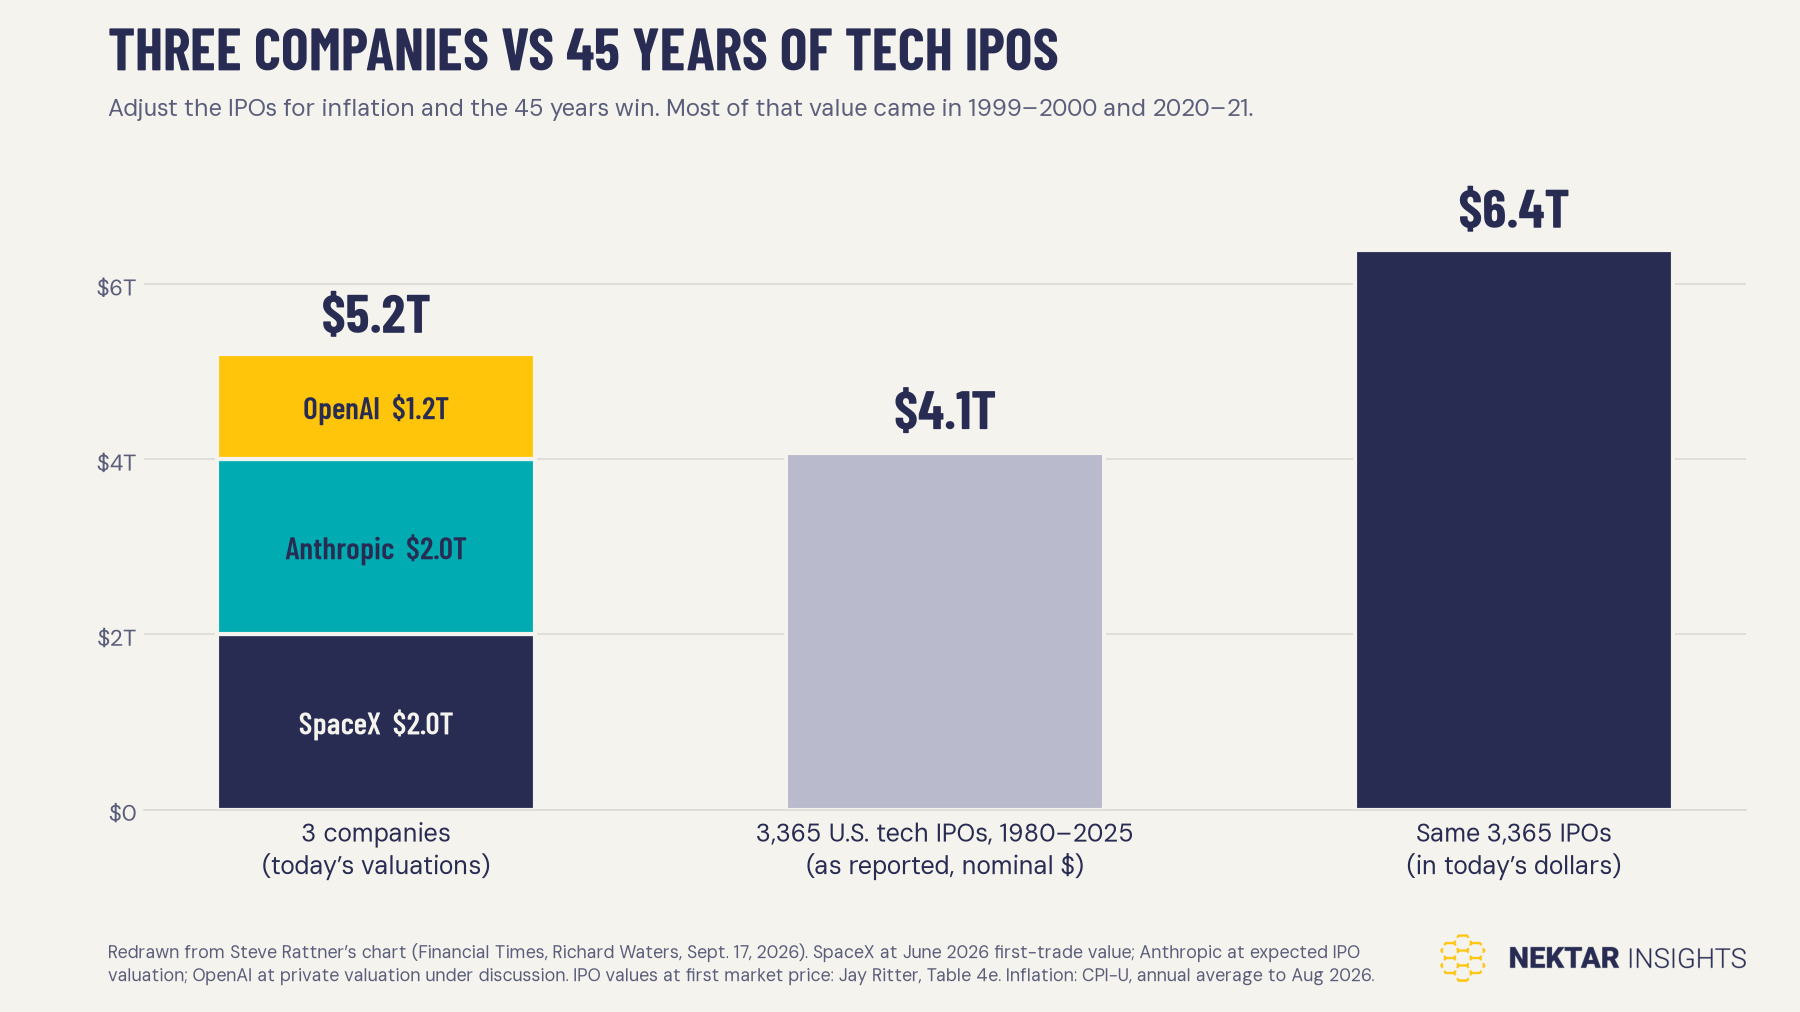
What to notice: Even after inflation, three companies equal about 80% of every tech IPO since 1980, and they haven't all gone public yet. That's the size of the handoff coming to public markets.
Private investors put that money in expecting a return. They get it back when they cash out: through IPOs, after the lockup ends, into index funds and retirement accounts. The debt that pays for the physical build is already sitting with pensions and insurers. When they cash out, the public carries the risk. Who's going to pick up the bag?
The Headwinds
The same week I talked to my steel friends, RSM's deputy chief economist spoke at the University of Utah's Eccles School. A few points lined up with what I was seeing:
- He called 5% a floor for the 10-year Treasury, not a ceiling. Money for long-lived projects is going to stay expensive.
- The shift toward open-source and local models argues against needing this much data center capacity long term.
- Construction labor is getting pulled into higher-paying data center jobs and away from housing.
Meanwhile the building gets more expensive and the product gets cheaper. Large power transformers cost 77% more than in 2019, and about 80% are imported. On the other side, Fidelity's tracker of LLM token spending swung from +56% to −49% on a 50-day basis this year, and GPU rental prices have stopped rising. Costs up, prices down, delivery slower. That's a squeeze.
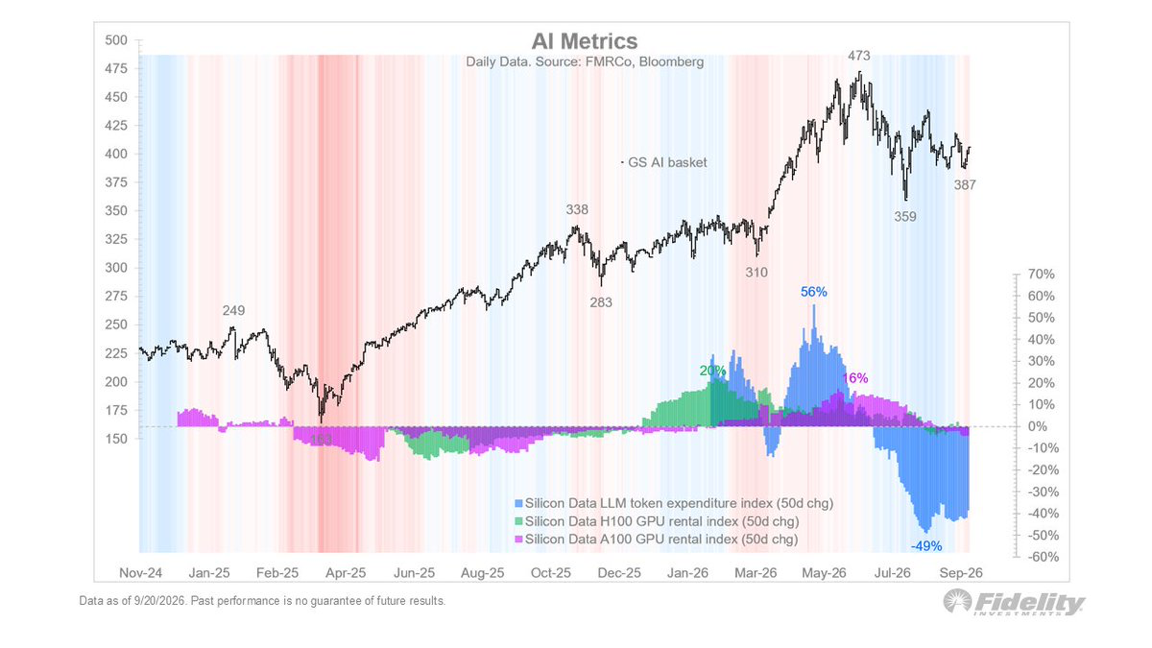
What to notice: The AI stocks peaked in June. Token spending turned down around the same time. The whole bet rides on usage growing faster than prices fall.
What I'm Watching
If I'm right, these turn in roughly this order.
| Signal | Where | What a crack looks like |
|---|---|---|
| Order cancellations | Mills and buyers | Buyers cancelling on mills (today it is the other way around) |
| Price sheets | Nucor-Yamato list | The heaviest sections get a published price again instead of "Inquire" |
| Lead times | Fabricators, transformer makers | They start getting shorter |
| Grid requests | Utility and ISO queues | Large-load requests get withdrawn |
| AI token spending | Usage and pricing trackers | Keeps falling faster than usage grows |
| Capex guidance | Hyperscaler earnings calls | The first "digest" or "optimize" language |
My Take
To me the demand is real. People are investing and building data centers. There are headwinds — adoption is slow, there are capacity constraints, labor, all those things. But it's all being financed, and the public is going to carry the risk.
In steel we'd often say: make as much money as you can, because we're going to give it all back. Some may say that's not a great mantra. It's commodity pricing.
We're in the early innings. I think AI will be significant. It's hard to forecast, and no one knows the hour of the correction. I'll be watching for when steel pricing drops.
The buildout is real and it's financed ahead of the revenue. The risk is moving to the public, and steel will turn first.
How I Built the Chart
- Source. Nucor-Yamato publishes a price list PDF. The Internet Archive captured it under several addresses between 2005 and 2025; I pulled every distinct version, plus the live list dated August 3, 2026.
- One comparable size. I tracked the W8x8 (31–67 lb/ft), a common light beam that appears on every sheet. Heavier sizes move the same way and are in the download.
- Surcharge included. Since 2006 the published price includes the raw-material surcharge. For the one 2005 sheet that listed them separately, I added them.
- The gaps. No full sheet survives for 2008. The mill's letters from that year only give changes: the surcharge went from $19.65/cwt in May to $0 by November. Dashed lines mark every stretch longer than about a year with no sheet.
- List isn't transaction. Buyers negotiate off the list, and everything is in nominal dollars.
Sources
- Nucor-Yamato Steel price lists and customer letters, 2005–2026, via the Internet Archive.
- Section 232 steel tariffs: 25% effective March 23, 2018 (USITC); raised to 50% effective June 4, 2025 (White House).
- Shanu Mathew, “Data Centers: Focus on Energized GW in a Noisy World of Politics, Delays, and Cancellations,” April 2026.
- Lawrence Berkeley National Laboratory, interconnection queue research (via Mathew).
- Fidelity (FMRCo, Bloomberg), “Crowding Out?” and “AI Metrics” charts, data as of September 20, 2026.
- Steve Rattner, “Three Companies, Worth More Than 45 Years of Tech IPOs,” from Financial Times reporting (Richard Waters, September 17, 2026).
- Jay Ritter, IPO Statistics, Table 4e (tech IPO market value by year, 1980–2025).
- Nucor hot-rolled coil consumer spot price, via Steel Market Update.
- RSM US deputy chief economist, “Navigating the Road Ahead: Economic Outlook and Election Insights,” David Eccles School of Business, September 23, 2026.
- CPI-U (BLS via FRED) for the inflation adjustment.